
Flood Watch
The 7th of May witnessed the third super moon of the year known as the full flower moon. Such super moons occur when the earth and moon’s elliptical orbit brings the earth and moon to their closest proximity or perigee and the moon appears approximately 15% larger in diameter. The event on the 7th of May was accentuated by clear night sky and resulted in an extremely bright yellow/golden glow on the moon’s surface.
The month of May continued with extremely low rainfall with only 12% of the average monthly rainfall recorded up to 20th. Day time temperatures have fluctuated from 8 to 24 degrees centigrade with a record of 27 degrees forecast for the 20th. This will be followed by some thundery weather with possible light rain with the end of the month returning to a more settled warmer spell.
In the May issue of the Prattler I mentioned assessing your own risk from flooding. Within the Village there are two possible causes, by river or brook or by flash flooding resulting from heavy rainfall. Flash flooding and local drainage is the responsibility of the LLFA whilst the E/A are responsible for the river and brook.
The following web sites provide a useful starting point:-
(a) GOV.UK Check your long term flood risk
(b) GOV.UK Flood map for Planning
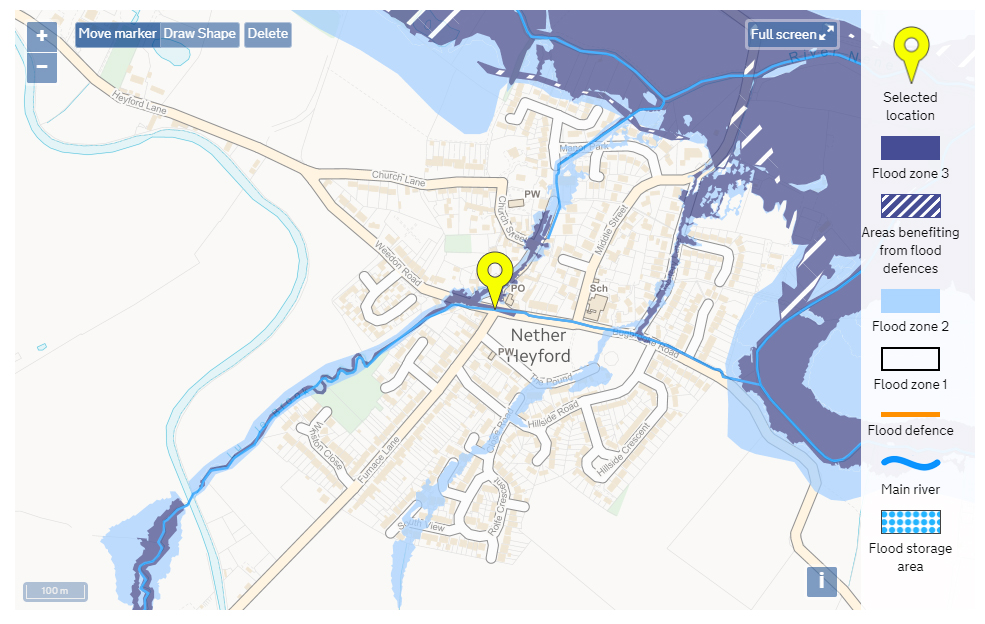
Nether Heyford: Flood map for planning
In (a) three categories are identified by zone 1, 2 or 3, zone 1 being lowest risk of 1 in 1000 years(0.1%) and zone 3 being 1 in 100 years(1%) or less. Zone 3 can be subdivided into 3a or 3b the latter being the natural floodplain of the river. In (b) the risks are categorised into low, medium and high. The NPPF rules require climate change to be taken into account especially when making planning applications. This requires an increase in river flow rates of up to 65% when predicting the increased impact of buildings estimated over 100 years.
None of the published risk maps include the impact of climate change.
As with any predictions of flood risk from modelling the results are subject to the accuracy of input data especially rainfall in catchment area and ground terrain profile accuracy. Even the choice of elements within the model and the selected grid size can radically change the output. The best cross check is to correlate to actual recorded events.
The most reliable sources of information lies within the local community especially with those that reside close to the potential sources of risk and who have first hand experience over several decades. So in assessing your risk familiarise yourself with the maps and then ask questions of local residents.
J.Arnold
Whilst our local flooding risk is comparatively low we must remain vigilant. Besides local and National weather news forecasts a reminder of the on-line access to real time data for rainfall and river levels is listed below:-
(A) Shoothill GaugeMap: www.gaugemap.co.uk


(B) River and sea levels Flood information service for England from Gov.uk
(C) Northamptonshire County Council: www.floodtoolkit.com
Finally don’t forget to register with the Environment Agency flood warning service on Floodline 03459 881188 to receive telephone and advanced flood warnings for the area.
J.Arnold
